




New this week: One Trade Live, a free 30-minute session every Thursday where this trade goes on screen. The Zoom link comes by email on Thursday morning to everyone on the free list.

What Is an Iron Condor. You sell a put at 75 and a call at 80 and collect 105 dollars per contract from traders who bet on a big move. You buy a put at 72 and a call at 83 as insurance, so the worst case is fixed at 195 dollars.
Enter all four legs as one order at the mid, net credit, day order. A few cents less credit is fine to get filled.
The Setup
TLT, the ETF of long US government bonds, closed at 77.11 on Monday, October 5, its lowest price since at least 2022 and 5.7 percent below its close of September 21. That sounds like a crash. Yet the worst single day in that stretch lost only 1.6 percent, and most days moved far less. Over the last 20 trading days TLT moved like an asset with about 10 percent yearly volatility, a slow grind.
Its options price 18 percent, higher than on any day of the past year. The market charges crash prices for a walk downhill, and that gap is what we sell, with an iron condor: four options that pay 105 dollars per contract up front and can lose at most 195. It makes money if TLT sits between 74.50 and 80.40 on November 4, when the plan closes it.
Where You Win, Where You Lose
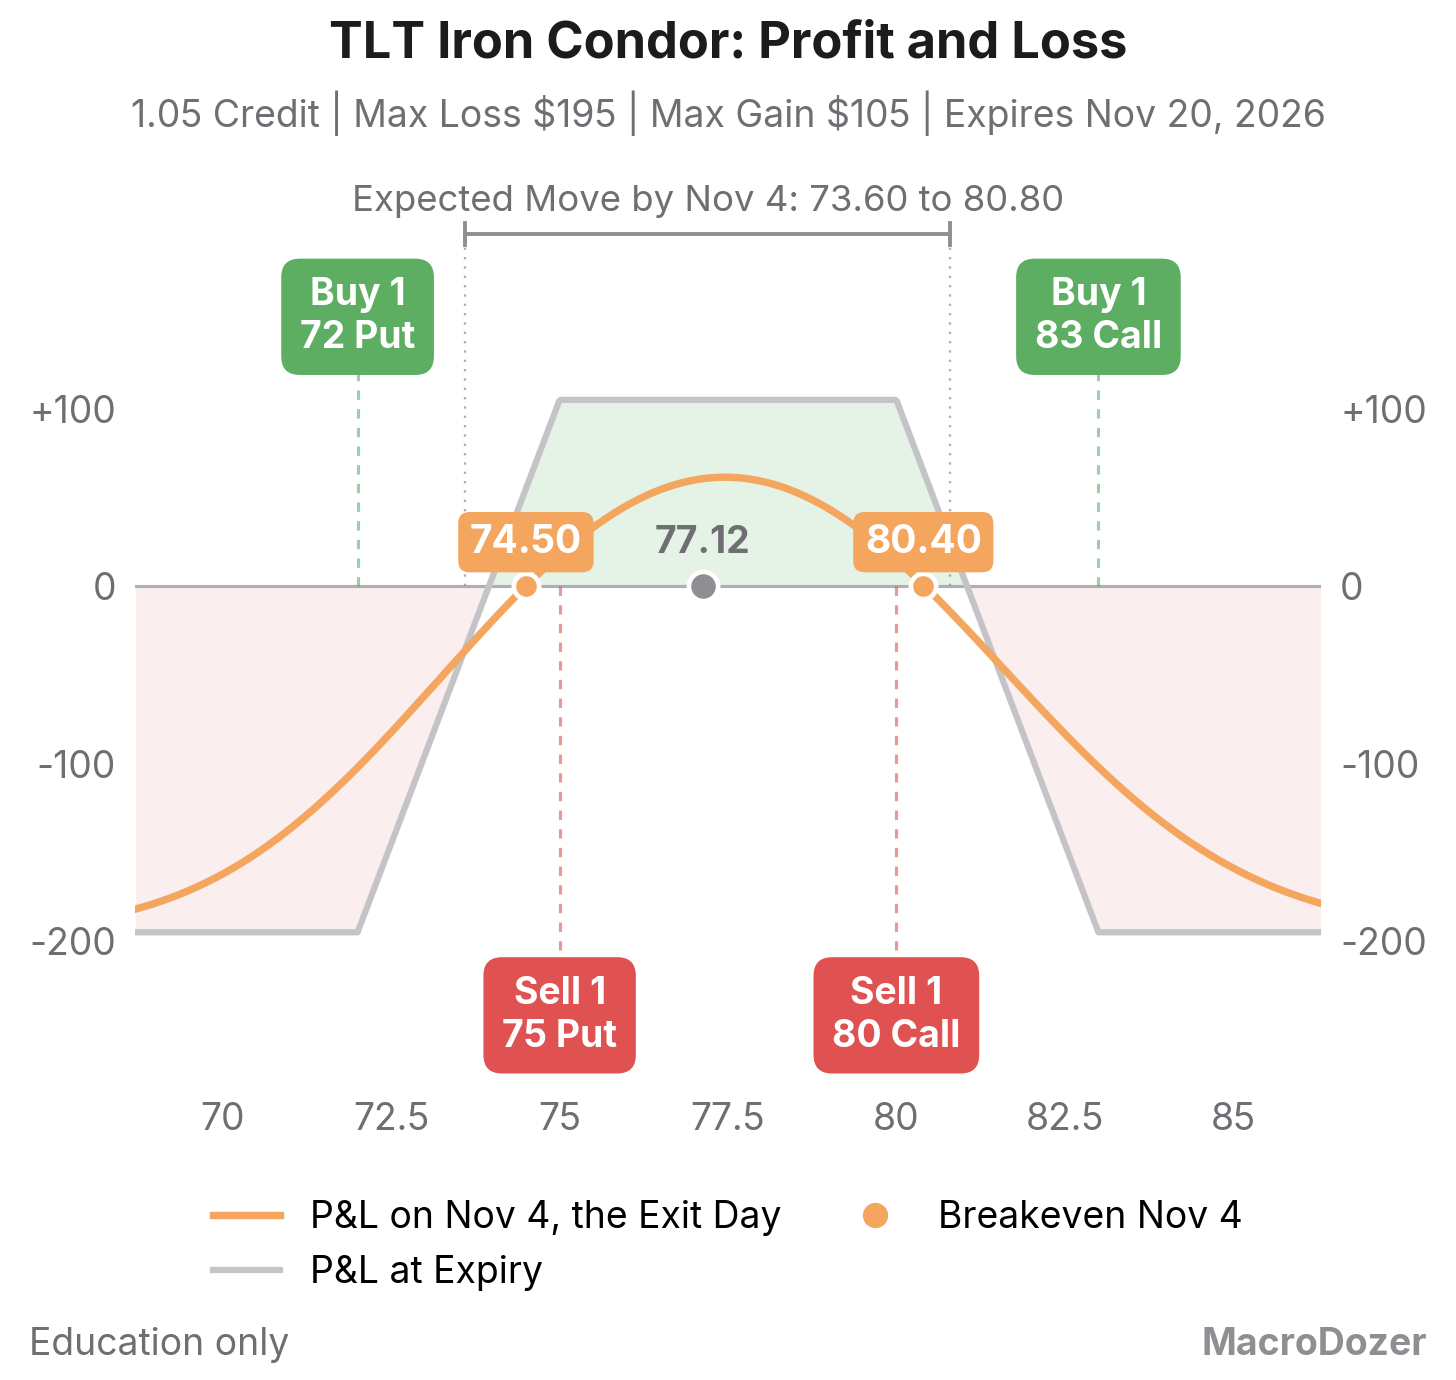
TLT iron condor, 1.05 credit: the grey line is the profit or loss at expiry, the orange curve on Nov 4, the exit day, with breakevens at 74.50 and 80.40. Max loss $195, max gain $105 per contract.
What you are betting. You are betting that TLT sits between 74.50 and 80.40 when the plan closes it on November 4. Near today's price our model shows about 60 dollars of profit by then. The full 105 needs November 20.
When we are wrong, and what we do then. The story breaks if the slow grind turns into a run: a hot inflation report or a failed auction that sends TLT fast below 74.50, or a growth scare that squeezes it above 80.40. 74.50 and 80.40 are where the trade stops making money on the exit day, the first warning. On a fast move, half the max loss sits near 71.00 and 83.50. The exit rule: out by Nov 4, 16 days before expiry; in the middle of the range, 76.30 to 78.70, I may hold longer. Earlier only if a fast move costs about half the max loss and the story has changed.
The Chart
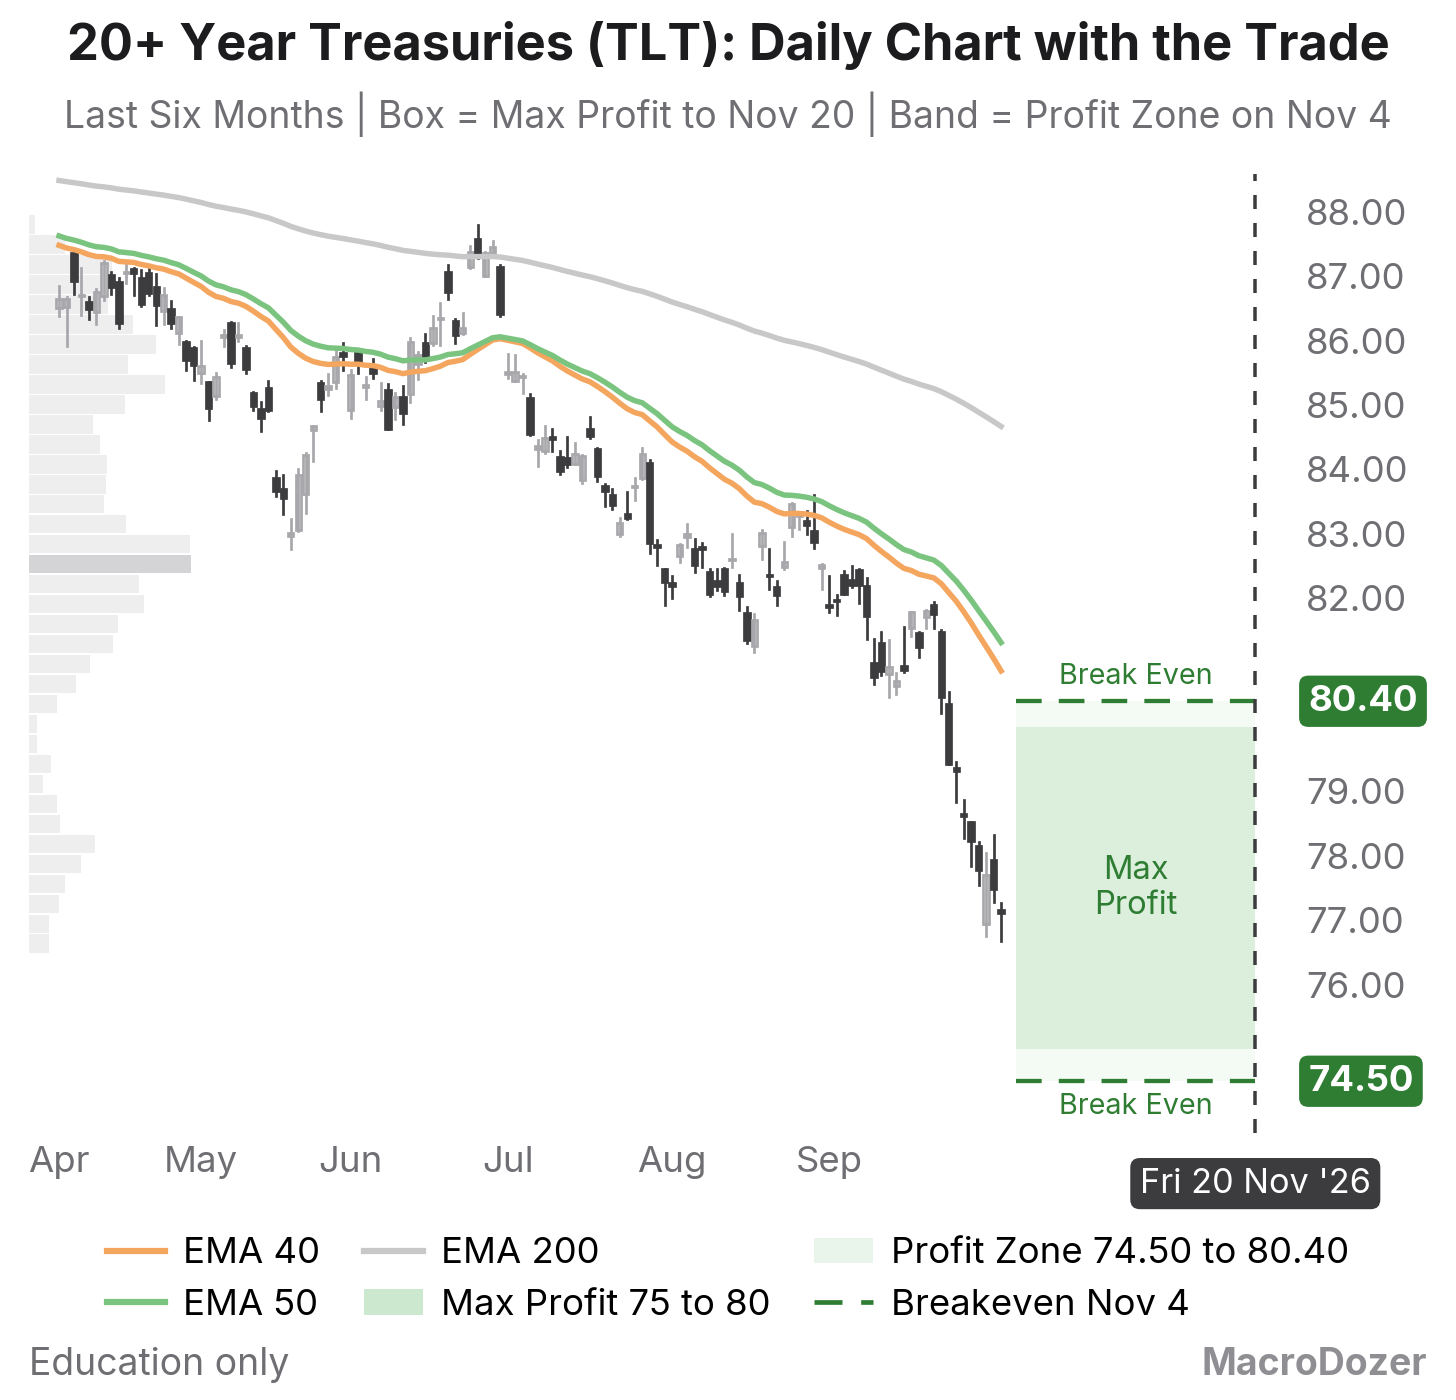
20+ Year Treasuries (TLT), daily candles over six months with the 40, 50 and 200 day averages. The box is where the whole credit is kept, the band between 74.50 and 80.40 is the profit zone on Nov 4.
Trend: down all year, from 90.82 on February 27 to 77.11, or 12.5 percent with the monthly dividends counted, below its 40, 50 and 200 day averages (80.87, 81.31 and 84.67).
Levels: this is the lowest price since at least 2022, so no old floor sits under it. The 80 area, where TLT last closed on September 23, sits just under the upper break-even.
The Big Picture
The bond market and the stock market live on different planets right now. The MOVE index of Treasury volatility jumped from 77 on September 10 to 113, close to its March panic high, while Goldman's panic index for stocks, a gauge from zero to ten, sits below 2 (Oct 5). Goldman also counts option volume on bond ETFs more than doubled in three weeks: traders now use TLT to bet on the economy.
I like to sell fear when it is crowded. Before Friday's jobs report, Goldman's trend model had systematic funds 99 percent of their maximum short in ten-year Treasuries (Oct 2). When everyone already owns the hedge, I would rather sell that insurance than buy it.
Three Things That Matter Before Nov 4
September payrolls rose just 29,000, below every estimate, and July turned negative after revisions (BLS, Oct 2). Jefferies' Tom Simons called it the nail in the coffin for an October hike. Fewer hike bets ease the selling, which helps our lower side.
The Treasury sells 39 billion dollars of ten-year notes on Wednesday and 22 billion of thirty-year bonds on Thursday (Deutsche Bank, Oct 5). Two weak auctions in a row could push TLT toward our lower break-even within days.
September inflation lands on October 14, the Fed decides on October 28 and the midterms follow on November 3, all before our exit on November 4. With TLT near a break-even into any of them, an early close is on the table.
Sources: MOVE index, Oct 5. Goldman, Oct 5. Goldman, Oct 2. BLS employment report, Oct 2. Jefferies' Tom Simons, Oct 2. Deutsche Bank, Oct 5. Federal Reserve, Oct 5. Prices: mid quotes, Oct 6.
One Trade Live This Thursday
Starting this week there is One Trade Live: every Thursday I go live on Zoom for thirty minutes and walk through the Tuesday Target trade on screen. This Thursday, October 8, at 3:30 pm London time, 10:30 am in New York: where the TLT trade stands, what has changed since Tuesday, and your questions. It is free. One click on the link and you are in, no Zoom account needed.
The Zoom link goes out by email on Thursday morning to everyone on the free Tuesday Target list. Not on it yet? Sign up here and it reaches you too.
Every Tuesday Target of the year, scored, winners and losers alike.
Every entry, repair and exit in my own account is posted the moment I make it: Trade Alerts, part of Pro.

Every Wednesday, Elite Traders watch me run a real portfolio live. A growing lesson library and ten one-on-one sessions with me come with it.

All articles are purely educational; they are not tailored to any particular individual or portfolio and do not constitute investment advice.