


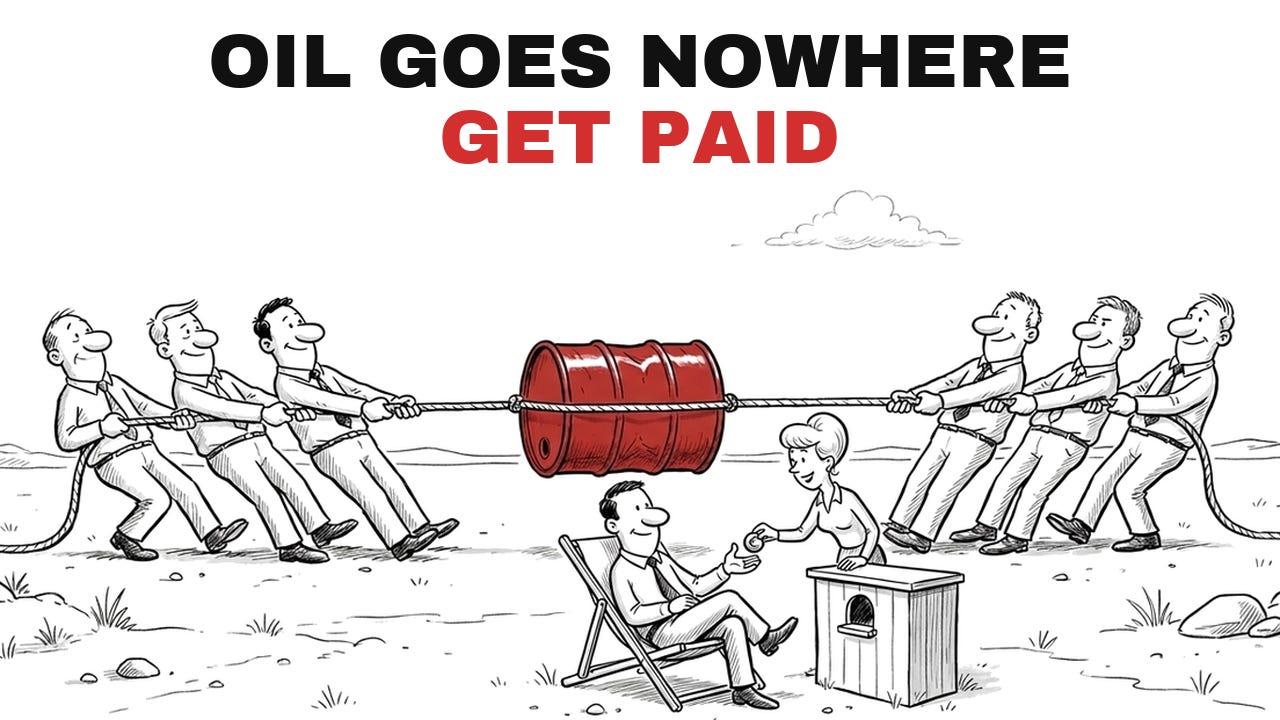

New from this issue: one defined-risk options trade a week, the exit rule printed on the card, every result scored in public. The long macro essay moves to The Desk once a month.

What Is an Iron Condor. You sell a put at 60 and a call at 65 and collect 220 dollars per contract from traders who bet on a big move. You buy a put at 55 and a call at 70 as insurance, so the worst case is fixed at 280 dollars.
Enter all four legs as one order at the mid, net credit, day order. A few cents less credit is fine to get filled.
The Setup
On Monday, September 28, US oil swung on one Iran headline after another and settled just 19 cents higher, at 92.60 dollars a barrel on NYMEX. That is oil in one day: a lot of noise, almost no distance. XLE, the ETF of the big American oil companies, has closed between 60 and 65 on 32 of the last 36 trading days and stood at 61.54 on Tuesday.
Yet options on XLE cost more than on three of every four days in the past year, while Goldman's panic index for stocks, a gauge from zero to ten, closed below one on Friday, Sep 25. Fear is expensive here and cheap everywhere else. So we sell it with an iron condor: four options that pay 220 dollars per contract up front and can lose at most 280. It makes money if XLE sits between 58.15 and 66.50 in late October, when the plan closes it.
Where You Win, Where You Lose
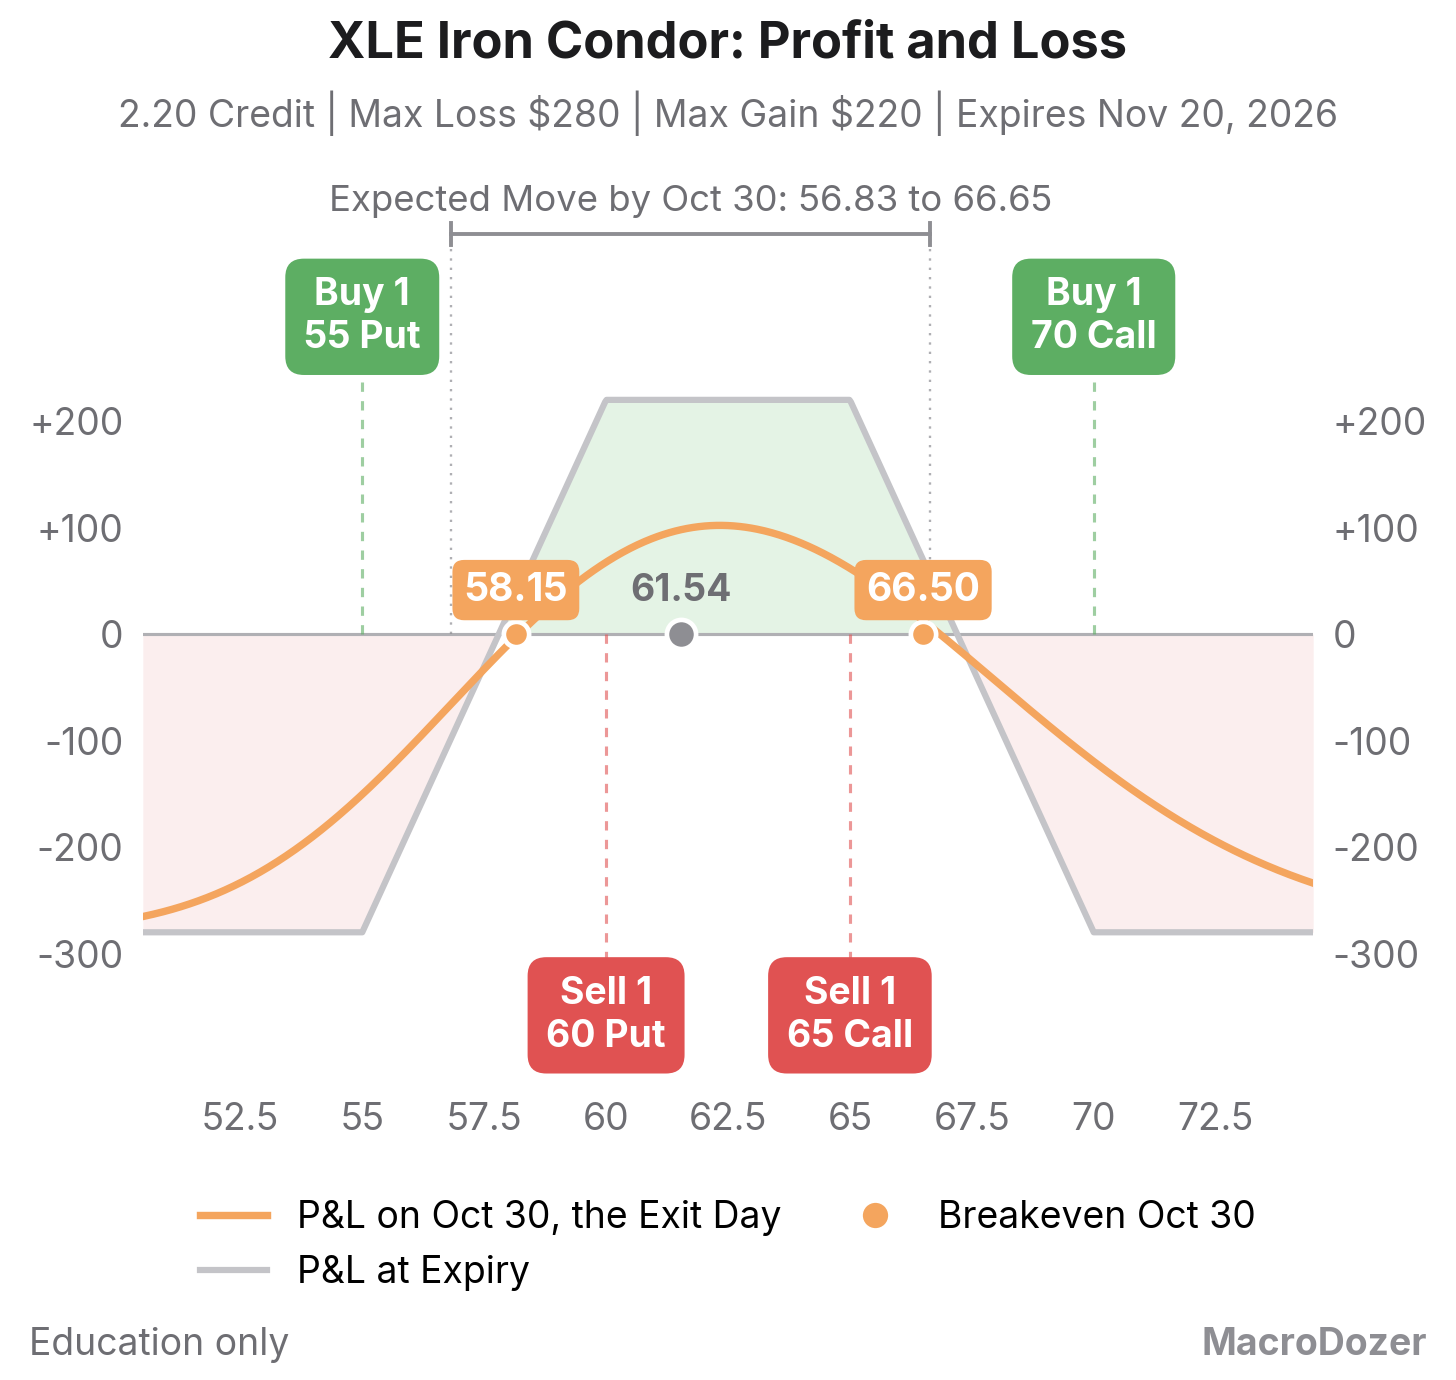
XLE iron condor, 2.20 credit: the grey line is the profit or loss at expiry, the orange curve on Oct 30, the exit day, with breakevens at 58.15 and 66.50. Max loss $280, max gain $220 per contract.
What you are betting. You are betting that XLE sits between 58.15 and 66.50 when the plan closes the trade in late October. Near 62 the position shows about 100 dollars of profit by then on our model. The full 220 would need the wait to November 20.
When we are wrong, and what we do then. The story breaks if the cap or the floor goes: an Iran deal reopens Hormuz, where BofA's Hartnett sees oil at 80 dollars (Sep 27), or a new Gulf front opens. 58.15 and 66.50 are where the trade stops making money on the exit day, the first warning. On a fast move, half the max loss sits near 54.50 and 72.50. The exit rule: out by Oct 29, the evening before Exxon and Chevron report; in the middle of the range, 60.90 to 64.10, I may hold through. Earlier only if a fast move costs about half the max loss and the story has changed.
The Chart
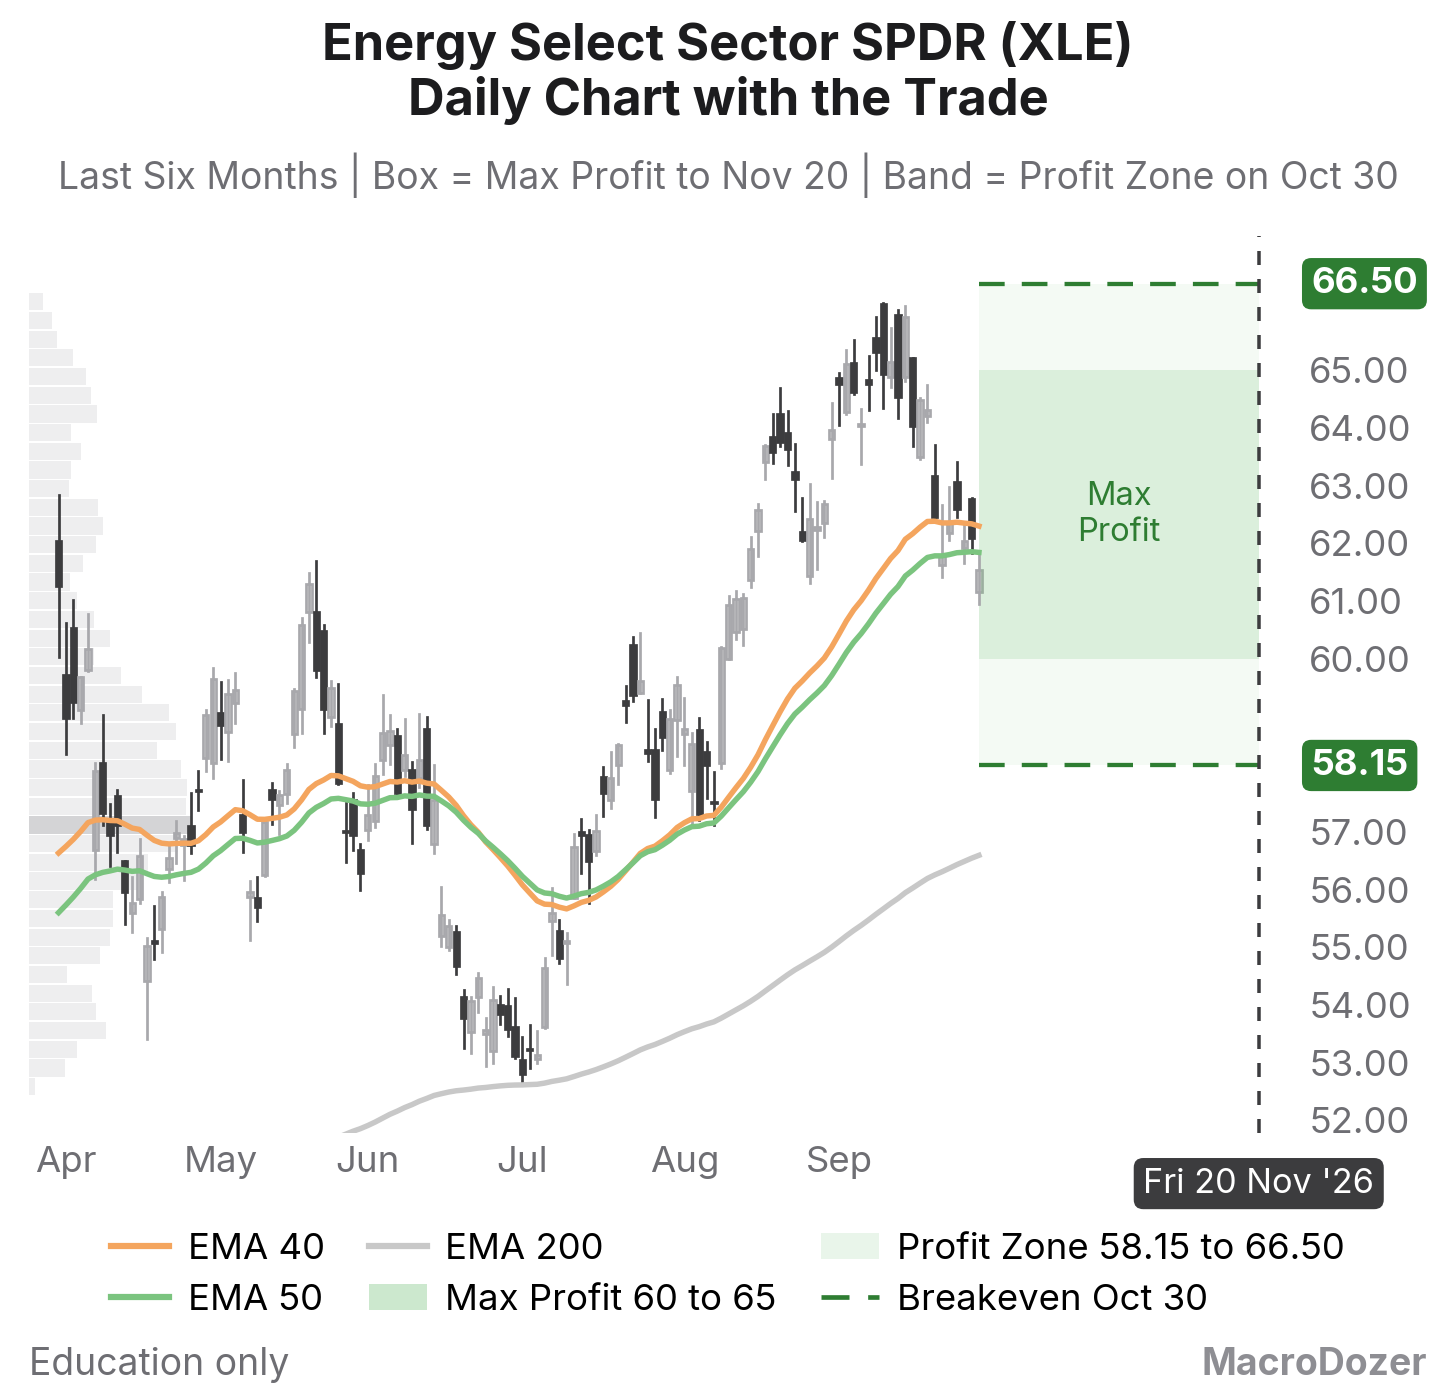
Energy Select Sector SPDR (XLE), daily candles over six months with the 40, 50 and 200 day averages. The box is where the whole credit is kept, the band between 58.15 and 66.50 is the profit zone on Oct 30.
Trend: up all year, from 45 in January to a high of 66.17 on September 10, now 7 percent lower and just under its 40 and 50 day averages (62.30 and 61.84).
Levels: 66.17, the September high, guards the upper breakeven. The 57 to 59 shelf of early August, the busiest price zone on the volume profile, guards the lower one.
The Big Picture
Oil now trades like a policy. When US oil nears 95 dollars, the headlines arrive around midday in New York, when trading is thinnest, and the price drops, notes Bloomberg's Frank Monkam (Sep 29). Goldman modeled a diesel export ban on Sep 28, before anyone had announced one. Oil and the ten-year Treasury yield now move together more tightly than at any time in 35 years, says Morgan Stanley (Sep 28).
Everyone hates this arrangement. I find it reassuring. A price with a manager has a ceiling near 95. A strait that stays shut keeps a floor under it: Polymarket gave normal traffic through Hormuz by year end a 22 percent chance on Sep 26. A capped and floored price drifts sideways, and sideways pays the patient.
Three Things That Matter Before Oct 29
The Fed decides on October 28. Traders price a 69 percent chance of a hike, yet since 1990 the Fed has never hiked in October before an election, says UBS (Sep 28). A hike would land the day before our planned exit.
JPMorgan's trading desk expects oil to trend lower in a choppy fashion and the ten-year yield to end the year at 5.05 percent (Sep 29). Choppy suits this trade. Lower is the risk: the put we sold at 60 sits 2.5 percent below XLE.
Chevron reports on October 30 before the open, and Exxon is expected the same day. On October 29 we look once: with XLE between 60.90 and 64.10 at the close I may hold through the reports, outside that band the plan is out.
Sources: NYMEX, Sep 28. Goldman, Sep 28. Bloomberg, Sep 29. Morgan Stanley, Sep 28. Polymarket, Sep 26. UBS, Sep 28. JPMorgan, Sep 29. BofA, Sep 27. Prices: mid quotes, Sep 29.
Every Tuesday Target of the year, scored, winners and losers alike.
Every entry, repair and exit in my own account is posted the moment I make it: Trade Alerts, part of Pro.

Every Wednesday I manage a real portfolio live on the Elite Trader call. The archive and ten one-on-one sessions with me come with it.

All articles are purely educational; they are not tailored to any particular individual or portfolio and do not constitute investment advice.