VIX FUTURES: Abusing Volatility 2/2
No One Correlates!
Executive Summary
S&P 500 implied volatility (VIX) always reverts to the mean.
Abusing UVXY to earn income targeting the mean looks promising.
Not the conventional way will get you there: Follow me on a quick dive into the world of options.
Risk is clearly defined, and execution is easier than you think.
1. Why Do I Care Right Now?
Rant Around The Permabull
For over half a year, I have observed an ongoing supply of buy recommendations for equities trending downwards brutally. Had I bought the dip every time a new ‘strong buy’ came out, marshals would have taken my laptop and switched off the electricity by now.
I understand that one can fall in love with one’s darlings. Still, constant pushing for higher market caps regardless of external factors such as money flows, sentiment, politics, or other macro events can seem odd.
So, what to do when darlings fall like knives from the sky, and a potential side-way move or a bear market is taking shape? One obvious answer is diversification and waiting it out. A bit of equities here, some commodities over there, FX, why not, and if possible, could you please hand me some of these bitcoins, and let’s see what happens…
Let me introduce you to something different and slightly more proactive. The exotic UVXY volatility product should already deliver on horizontal asset class diversification. However, I also want to showcase vertical diversification by using alternative tools to execute a trade.
The investment idea is to utilize the UVXY to express the S&P 500 implied volatility reverting to the mean over the next month or two.
This is a timely matter since continuing to lose money on non-performing equities should not be the only option in the short- to mid-term, and the Cboe Volatility Index (VIX) trading at the upper end of its 12 months trading range does increase the chances of success.
2. Useful Background Information
To get a better understanding and to become more comfortable dealing with volatility, I will highlight the essential facts and mechanics of 1) Cboe Volatility Index (VIX), 2) Cboe Volatility Index Futures (/VX), 3) S&P 500 VIX Short-Term Futures Index (SPVIXSTR) and 4) ProShares Ultra VIX Short-Term Futures ETF (UVXY). You need to understand the basics of 1-3 to have a go at 4; they are all closely related.
2.1 Cboe Volatility Index (VIX)
Non-tradable financial benchmark, designed to be a real-time market estimate of the S&P 500’s expected volatility (implied volatility).
Measures how much the market thinks the S&P 500 will fluctuate over the next 30 days, shown as an annualized percentage.
Derived from the midpoint option bid/ask quotes of the S&P 500 (SPX).
Example: Assume S&P at 4,000 and VIX at 30. The expected one standard deviation move (68% probability) over the next 30 days calculates as follows (quick and dirty):
4,000 * 30% * [SQRT(30 days) / SQRT(365 days)] = +/- 344
The S&P 500 is expected to trade between 3,656 and 4,344 over the next 30 days, with a 68% probability.
2.2 Cboe Volatility Index Futures (/VX)
Tradable futures contracts, based on Cboe Volatility Index (VIX).
Reflects the market estimate of VIX on various future expiration dates.
2.3 S&P 500 VIX Short-Term Futures Index (SPVIXSTR)
A non-tradable financial benchmark that utilizes and replicates the return of the nearest two VIX futures contracts on a 30-day forward rolling basis.
Rolls daily from the shorter-term /VX futures into the longer-term /VX futures contract to keep both months correctly weighted inside the 30-day rolling period.
2.4 ProShares Ultra VIX Short-Term Futures ETF (UVXY)
Tradable ETF; provides 1.5x leveraged exposure to S&P 500 VIX Short-Term Futures Index (introduced above in 2.3).
The 1.5x leveraged exposure shows accurately for individual days.
Returns over periods of more than one day can differ in amount and direction due to the compounding effects of leverage.
The mechanics of and costs related to both rolls of futures contracts and 1.5x leverage show the price of UVXY as ever declining on a chart.
Reverse splits are needed every 6-30 months, depending on the /VX futures term structure (contango vs. backwardation).
Now, with the technicalities out of the way, let me shed some more light on the actual behavior and movements of the VIX and its levered derivative UVXY so that the investment idea will become more apparent.
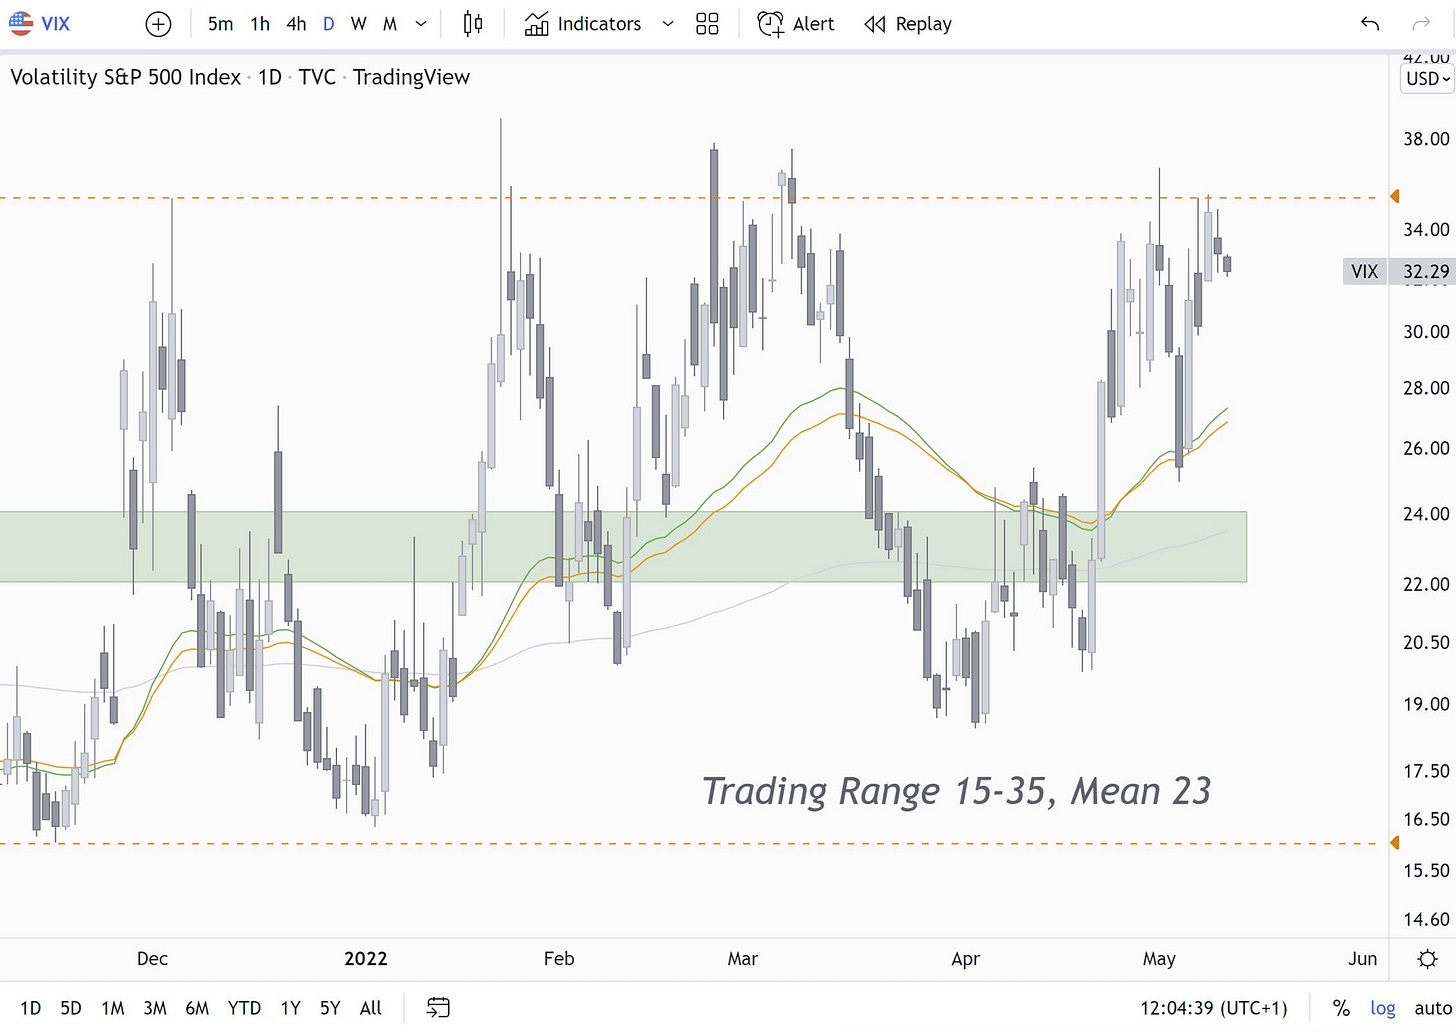
The VIX, nothing more than the 30 days’ forward-looking implied volatility of the S&P 500, is mean-reverting like every implied volatility of any other asset on which options trade. The length of the cycle or wave from mean to mean is usually around 40-60 days.
Over the last six months, the VIX traded between 15 and 35, and for the sake of simplicity, we call the mean at 23, right where the 200-day moving average is.
As the VIX is not tradeable, let us find the equivalent on the UVXY chart. The /VX futures market is usually in contango, meaning the spot price or front-month /VX futures trade at a discount to the next month or back months. The UVXY usually shows a drag in price due to daily rolling, selling the cheaper front month, and buying back the more expensive back month. This must be acknowledged and understood, even for a shorter-term engagement in the product. This has not been the case over the last months, as the /VX futures market has been in backwardation, meaning the front month is more expensive than the back month. Here, rolling from front to back gives the price of the ETF an additional push to the upside.
Over the last six months, UVXY traded between 11 and 23, and again for simplicity, we call the mean at 15, right where the 50-day moving average is.
The following section will illustrate how a potential mean-reverting UVXY can be expressed as a 2-month duration trade, serving additional income in times of more uncertain stock markets.
3. Trade Execution
In an increasingly fast-paced and volatile environment, fundamentals and macro data will continue to be the pinnacle of investment success in the long run.
However, the art of executing and managing trades can provide an additional edge. Compared to the set-up of an institutional investor, there is close to nothing one cannot do in a modern retail brokerage account, so why not use all available tools to our advantage?
This section divides into Greenhorn and Wizard. Under Greenhorn, we express the investment execution conventionally. Under Wizard, we utilize derivatives for an extra edge; expect innovative income strategies and improved risk/ return set-ups in the future.
3.1 Greenhorn
The conventional way of short-selling UVXY and placing a reasonable stop-loss above the price is impossible; virtually no one can borrow UVXY shares.
There is an inverse volatility product called ProShares Short VIX Short-Term Futures ETF (SVXY). However, a high expense ratio of nearly 1.0% plus the compounding effects of daily returns for an inverse -0.5x SPVIXSTR performance tracker (see 2.3) makes it a slow and expensive product.
3.2 Wizard
There are endless ways to put on a mean-reverting UVXY trade in the world of options. The best individual strategy may derive from personal assumptions on the underlying’s expected move, its option pricing, and the respective risk/reward scenarios.
For educational purposes, I will share my favorite strategy at this moment. However, the entire article is for educational purposes only. This investment idea is not tailored to any person or portfolio and does not constitute investment advice.
Let’s have a second look at the UVXY chart. Again, I highlighted the mean at around 15 in green. Furthermore, I drew an expected price development over the next two months on the chart.
Selling a 15-strike Iron Butterfly with wings at 5 and 25 (horizontal red dotted lines), expiring on Jul 15, 2022 (vertical grey dotted line), is a fair strategy to express UVXY reverting to the mean within a 60-day window. The Butterfly wings at 5 and 25 will define the risk and optimize the use of capital. Break-even points are 15 +/- 5.80 credit received (horizontal green dotted lines).
Trade Entry - May 13, 2022
See below the complete overview, including a pay-out graph.
1) Short Call 15, Jul 15, 2022: 6.90 Credit.
2) Short Put 15, Jul 15, 2022: 2.75 Credit.
3) Long Call 25, Jul 15, 2022: 4.40 Debit.
4) Long Put 5, Jul 15, 2022: 0.03 Debit.
Total: 5.80 Credit.
The credit received is 5.80, which would be the maximum profit. The maximum loss is 4.20, limited by both long wings.
Depending on UVXY price development, one should take off the trade at a 30-50% return on credit received, meaning the credit of 5.80 should have decreased to 3.00-4.00.
4. Final Comments
Expect updates on BrainDoζers within 4-6 weeks. We use the exact heading, ending with (+/- xy%), and label the cover cartoon with a red Doζed stamp. That way, the performance will be easy to follow.
We are not sending BrainDoζer updates via email unless you specifically ask for it here. We want to keep the information flow light and to the point. You can still freely access all updates on MacroDozer the moment they are released.
My name is Juri von Randow. You can find me on the top banner to the right. MacroDoζing, as if there was no tomorrow. (Email version only.)
Feel free to share. Sincerely.


